I've seen and read a lot about ratio tables and my initial attempts to use them started with year 8 percentages. They already had an idea of how to find basic percentages and an idea of FDP from year 7. I showed them a couple of different ways of visualising finding percentages of amounts, including dual number lines and ratio tables. We discussed which methods they liked and why. I was really surprised they liked the ratio tables, so I decided to stick with ratio tables to do some of the more complex percentage problems they needed to do and was surprised how universal they were for percentage problems, and how naturally multipliers come out of the method.
As with a lot of scaffolds, structures or manipulatives students need to be able to do the basics to be able to do more complex things later. You have to lay the foundations first! I would even go back and ensure they understand the principles of basic ratio tables before even introducing them in a percentages context. Ratio tables are a useful scaffold for many topics across the curriculum, and the more confident they are with the basics the easier they become in more difficult contexts. It is well worth investing time in the basics if you want to see the impact long term.
1. Basic percentages of amounts
I started with basic percentages of amounts to get students used to the structure and start the thinking about multipliers.
For example, find 40% of 80:
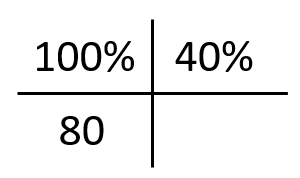


Method 3: Multiplying down


Also discussing different methods and which is most efficient for each question or if there is anything surprising between the questions.
2. Percentage Increase and Decrease
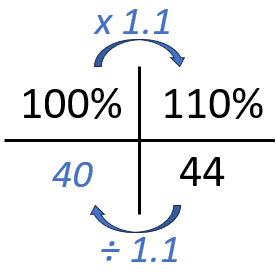
Example: Increase 70 by 20%

Setting up the ratio table, again I always start with 100% top left with the full amount underneath, then the percentage I'm looking to find top right, in this case 120%. So now we find the gap using one of the methods below either in one step (preferable):


In which case, you support students in aiming to get towards one step eventually as it is the most efficient way - particularly when students have a calculator. It is also quite nice to let students discuss how dividing by ten and multiplying by twelve is the same as multiplying by 1.2 and also dividing by 5 and multiplying by six. You can write them as fractions instead of decimals and really reinforce the importance and equivalence of FDP.
Some questions I might give students to practice and hopefully get them thinking:

3. Finding the original (100%) or Reverse Percentages
The cost of a train ticket increases by 10%. It now costs £44 for a return to Liverpool. How much did it cost before the price increase?
So in this question, we are given different information. Students may struggle initially working out what goes where in their table, but once they have the table filled in, it isn't a massive jump from increasing and decreasing by a percentage:

So the set up is different because this time, you are given that 110% is £44 in the question.
If students are confident with inverse operations, they can then use the fact they need to use inverse operations to find 100%:


Again, this is with the aim of eventually being able to do it using a single multiplier in one go.
I'd ask some questions such as the following to hopefully get students thinking whilst practicing:

4. Writing as a percentage/percentage change
You can also use the structure to write anything as a percentage or to find a percentage change.
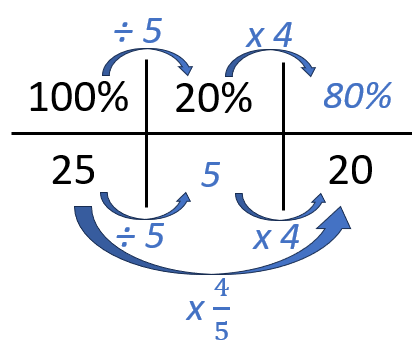
Example: Sally gets 20 out of 25 on her spelling test. What is her score as a percentage?

This time we are told 100% full marks is 25, the score is 20 so we need to find that as a percentage (top right corner). There are two ways of doing this one downwards:

As a bit of a bonus in terms of building connections, you can discuss why x by 0.25 or one quarter is equivalent to dividing by 4 and there is potential to bring in reciprocals.
Again, if needed split into steps which also can lend itself to relating the FDP equivalence again, and lends itself to discussing reciprocals:
Again, I'd give them some questions to practice whilst also trying to get them to reflect on similarities and differences:

And once they've done all the different types of questions, giving them some which I believe might count as 'same surface, different depth' to pull out the wording of questions and which is which type of question:


I'd also, from experience, ensure I show different contexts other than just money, so students see plenty of different contexts where percentages questions arise so they can apply the knowledge more flexibly to different contexts.
The students seemed to find the ratio tables really useful, as it was one structure to answer every type of question. They seem to more easily grasp multipliers as a concept and more naturally see when to divide by the multiplier. I really love how they highlight different relationships that other methods maybe wouldn't so easily lend themselves to. I am really looking forward to seeing how they will work beyond just percentages!


